On Mon, Jul 15, 2024 at 5:47 PM Stepan Neretin <sncfmgg(at)gmail(dot)com> wrote:
>
>
> On Mon, Jul 15, 2024 at 4:52 PM Stepan Neretin <sncfmgg(at)gmail(dot)com> wrote:
>
>>
>>
>> On Mon, Jul 15, 2024 at 12:23 PM Антуан Виолин <violin(dot)antuan(at)gmail(dot)com>
>> wrote:
>>
>>> Hello all.
>>>>
>>>> I have decided to explore more areas in which I can optimize and have
>>>> added
>>>> two new benchmarks. Do you have any thoughts on this?
>>>>
>>>> postgres=# select bench_int16_sort(1000000);
>>>> bench_int16_sort
>>>>
>>>>
>>>> -----------------------------------------------------------------------------------------------------------------
>>>> Time taken by usual sort: 66354981 ns, Time taken by optimized sort:
>>>> 52151523 ns, Percentage difference: 21.41%
>>>> (1 row)
>>>>
>>>> postgres=# select bench_float8_sort(1000000);
>>>> bench_float8_sort
>>>>
>>>>
>>>> ------------------------------------------------------------------------------------------------------------------
>>>> Time taken by usual sort: 121475231 ns, Time taken by optimized sort:
>>>> 74458545 ns, Percentage difference: 38.70%
>>>> (1 row)
>>>>
>>>
>>> Hello all
>>> We would like to see the relationship between the length of the sorted
>>> array and the performance gain, perhaps some graphs. We also want to see
>>> to set a "worst case" test, sorting the array in ascending order when it
>>> is initially descending
>>>
>>> Best, regards, Antoine Violin
>>>
>>> postgres=#
>>>>
>>>
>>> On Mon, Jul 15, 2024 at 10:32 AM Stepan Neretin <sncfmgg(at)gmail(dot)com>
>>> wrote:
>>>
>>>>
>>>>
>>>> On Sat, Jun 8, 2024 at 1:50 AM Stepan Neretin <sncfmgg(at)gmail(dot)com>
>>>> wrote:
>>>>
>>>>> Hello all.
>>>>>
>>>>> I am interested in the proposed patch and would like to propose some
>>>>> additional changes that would complement it. My changes would
>>>>> introduce similar optimizations when working with a list of integers
>>>>> or object identifiers. Additionally, my patch includes an extension
>>>>> for benchmarking, which shows an average speedup of 30-40%.
>>>>>
>>>>> postgres=# SELECT bench_oid_sort(1000000);
>>>>> bench_oid_sort
>>>>>
>>>>>
>>>>> ----------------------------------------------------------------------------------------------------------------
>>>>> Time taken by list_sort: 116990848 ns, Time taken by list_oid_sort:
>>>>> 80446640 ns, Percentage difference: 31.24%
>>>>> (1 row)
>>>>>
>>>>> postgres=# SELECT bench_int_sort(1000000);
>>>>> bench_int_sort
>>>>>
>>>>>
>>>>> ----------------------------------------------------------------------------------------------------------------
>>>>> Time taken by list_sort: 118168506 ns, Time taken by list_int_sort:
>>>>> 80523373 ns, Percentage difference: 31.86%
>>>>> (1 row)
>>>>>
>>>>> What do you think about these changes?
>>>>>
>>>>> Best regards, Stepan Neretin.
>>>>>
>>>>> On Fri, Jun 7, 2024 at 11:08 PM Andrey M. Borodin <
>>>>> x4mmm(at)yandex-team(dot)ru> wrote:
>>>>>
>>>>>> Hi!
>>>>>>
>>>>>> In a thread about sorting comparators[0] Andres noted that we have
>>>>>> infrastructure to help compiler optimize sorting. PFA attached PoC
>>>>>> implementation. I've checked that it indeed works on the benchmark from
>>>>>> that thread.
>>>>>>
>>>>>> postgres=# CREATE TABLE arrays_to_sort AS
>>>>>> SELECT array_shuffle(a) arr
>>>>>> FROM
>>>>>> (SELECT ARRAY(SELECT generate_series(1, 1000000)) a),
>>>>>> generate_series(1, 10);
>>>>>>
>>>>>> postgres=# SELECT (sort(arr))[1] FROM arrays_to_sort; -- original
>>>>>> Time: 990.199 ms
>>>>>> postgres=# SELECT (sort(arr))[1] FROM arrays_to_sort; -- patched
>>>>>> Time: 696.156 ms
>>>>>>
>>>>>> The benefit seems to be on the order of magnitude with 30% speedup.
>>>>>>
>>>>>> There's plenty of sorting by TransactionId, BlockNumber,
>>>>>> OffsetNumber, Oid etc. But this sorting routines never show up in perf top
>>>>>> or something like that.
>>>>>>
>>>>>> Seems like in most cases we do not spend much time in sorting. But
>>>>>> specialization does not cost us much too, only some CPU cycles of a
>>>>>> compiler. I think we can further improve speedup by converting inline
>>>>>> comparator to value extractor: more compilers will see what is actually
>>>>>> going on. But I have no proofs for this reasoning.
>>>>>>
>>>>>> What do you think?
>>>>>>
>>>>>>
>>>>>> Best regards, Andrey Borodin.
>>>>>>
>>>>>> [0]
>>>>>> https://www.postgresql.org/message-id/flat/20240209184014.sobshkcsfjix6u4r%40awork3.anarazel.de#fc23df2cf314bef35095b632380b4a59
>>>>>
>>>>>
>>>> Hello all.
>>>>
>>>> I have decided to explore more areas in which I can optimize and have
>>>> added two new benchmarks. Do you have any thoughts on this?
>>>>
>>>> postgres=# select bench_int16_sort(1000000);
>>>> bench_int16_sort
>>>>
>>>>
>>>> -----------------------------------------------------------------------------------------------------------------
>>>> Time taken by usual sort: 66354981 ns, Time taken by optimized sort:
>>>> 52151523 ns, Percentage difference: 21.41%
>>>> (1 row)
>>>>
>>>> postgres=# select bench_float8_sort(1000000);
>>>> bench_float8_sort
>>>>
>>>>
>>>> ------------------------------------------------------------------------------------------------------------------
>>>> Time taken by usual sort: 121475231 ns, Time taken by optimized sort:
>>>> 74458545 ns, Percentage difference: 38.70%
>>>> (1 row)
>>>>
>>>> postgres=#
>>>>
>>>> Best regards, Stepan Neretin.
>>>>
>>>
>>
>> I run benchmark with my patches:
>> ./pgbench -c 10 -j2 -t1000 -d postgres
>>
>> pgbench (18devel)
>> starting vacuum...end.
>> transaction type: <builtin: TPC-B (sort of)>
>> scaling factor: 10
>> query mode: simple
>> number of clients: 10
>> number of threads: 2
>> maximum number of tries: 1
>> number of transactions per client: 1000
>> number of transactions actually processed: 10000/10000
>> number of failed transactions: 0 (0.000%)
>> latency average = 1.609 ms
>> initial connection time = 24.080 ms
>> tps = 6214.244789 (without initial connection time)
>>
>> and without:
>> ./pgbench -c 10 -j2 -t1000 -d postgres
>>
>> pgbench (18devel)
>> starting vacuum...end.
>> transaction type: <builtin: TPC-B (sort of)>
>> scaling factor: 10
>> query mode: simple
>> number of clients: 10
>> number of threads: 2
>> maximum number of tries: 1
>> number of transactions per client: 1000
>> number of transactions actually processed: 10000/10000
>> number of failed transactions: 0 (0.000%)
>> latency average = 1.731 ms
>> initial connection time = 15.177 ms
>> tps = 5776.173285 (without initial connection time)
>>
>> tps with my patches increase. What do you think?
>>
>> Best regards, Stepan Neretin.
>>
>
> I implement reverse benchmarks:
>
> postgres=# SELECT bench_oid_reverse_sort(1000);
> bench_oid_reverse_sort
>
>
> ----------------------------------------------------------------------------------------------------------
> Time taken by list_sort: 182557 ns, Time taken by list_oid_sort: 85864
> ns, Percentage difference: 52.97%
> (1 row)
>
> Time: 2,291 ms
> postgres=# SELECT bench_oid_reverse_sort(100000);
> bench_oid_reverse_sort
>
>
> -------------------------------------------------------------------------------------------------------------
> Time taken by list_sort: 9064163 ns, Time taken by list_oid_sort: 4313448
> ns, Percentage difference: 52.41%
> (1 row)
>
> Time: 17,146 ms
> postgres=# SELECT bench_oid_reverse_sort(1000000);
> bench_oid_reverse_sort
>
>
> ---------------------------------------------------------------------------------------------------------------
> Time taken by list_sort: 61990395 ns, Time taken by list_oid_sort:
> 23703380 ns, Percentage difference: 61.76%
> (1 row)
>
> postgres=# SELECT bench_int_reverse_sort(1000000);
> bench_int_reverse_sort
>
>
> ---------------------------------------------------------------------------------------------------------------
> Time taken by list_sort: 50712416 ns, Time taken by list_int_sort:
> 24120417 ns, Percentage difference: 52.44%
> (1 row)
>
> Time: 89,359 ms
>
> postgres=# SELECT bench_float8_reverse_sort(1000000);
> bench_float8_reverse_sort
>
>
> -----------------------------------------------------------------------------------------------------------------
> Time taken by usual sort: 57447775 ns, Time taken by optimized sort:
> 25214023 ns, Percentage difference: 56.11%
> (1 row)
>
> Time: 92,308 ms
>
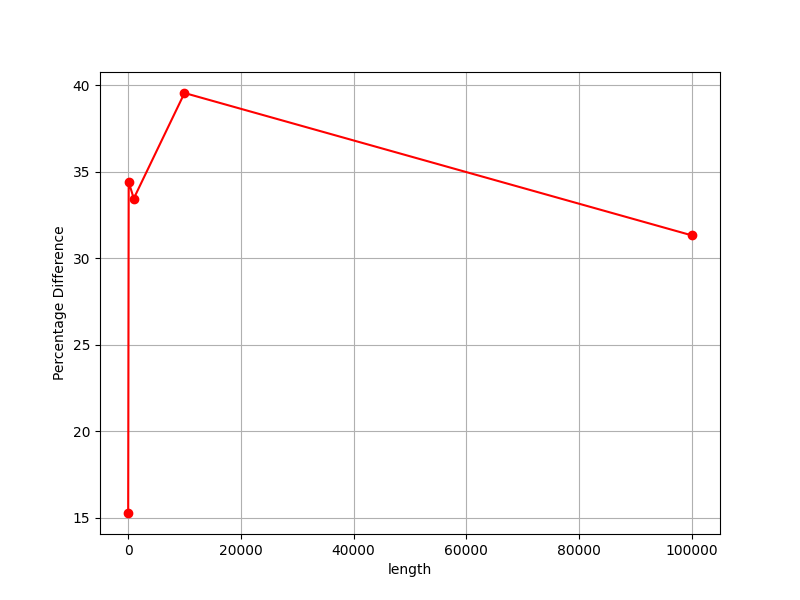
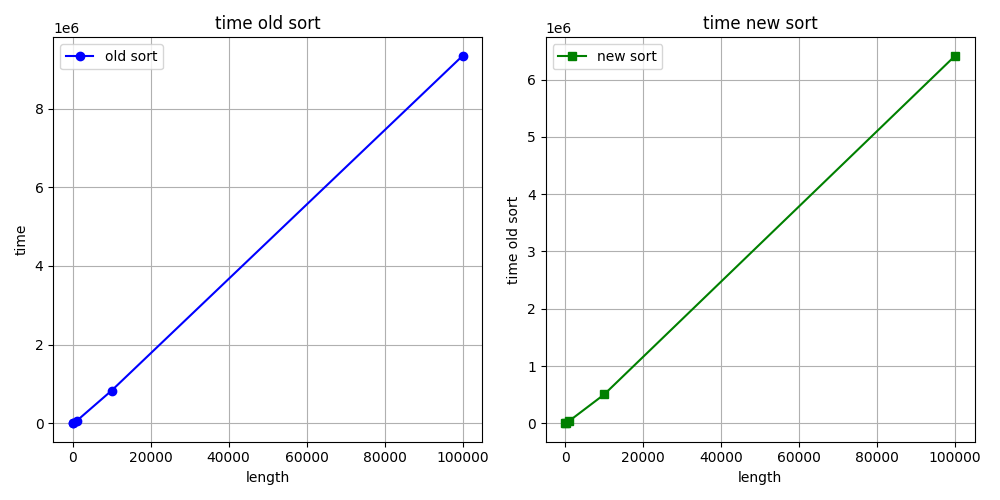
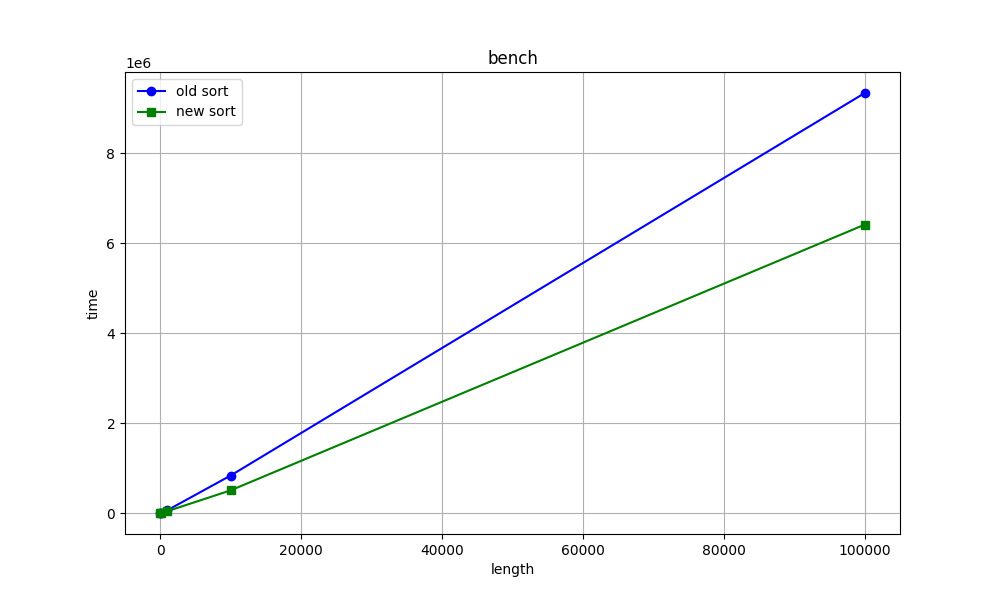
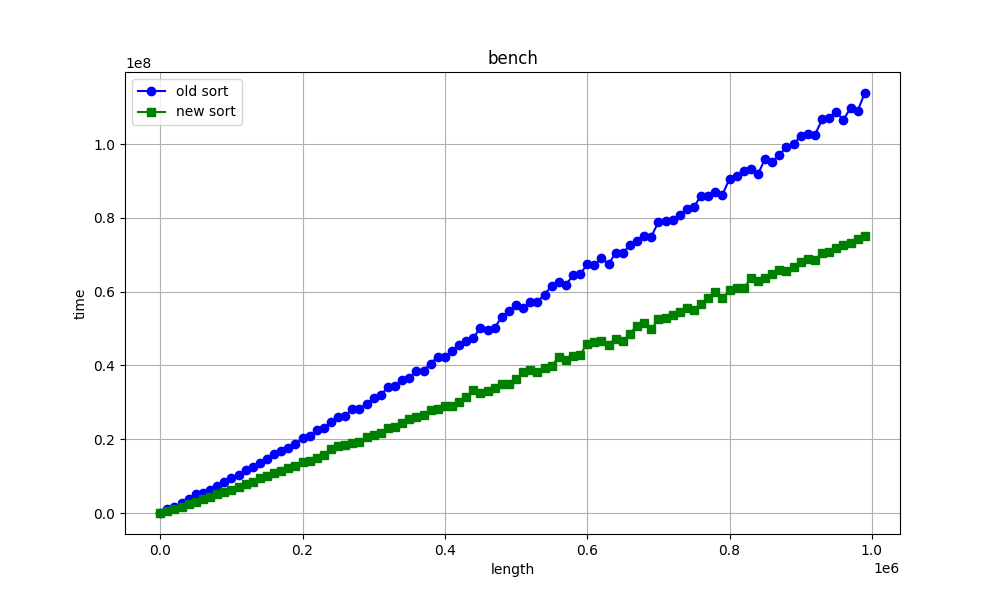
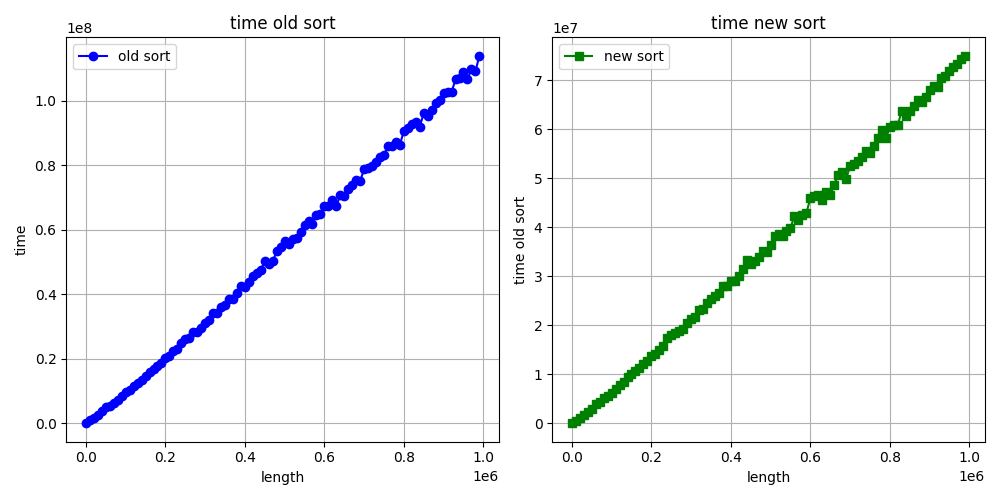
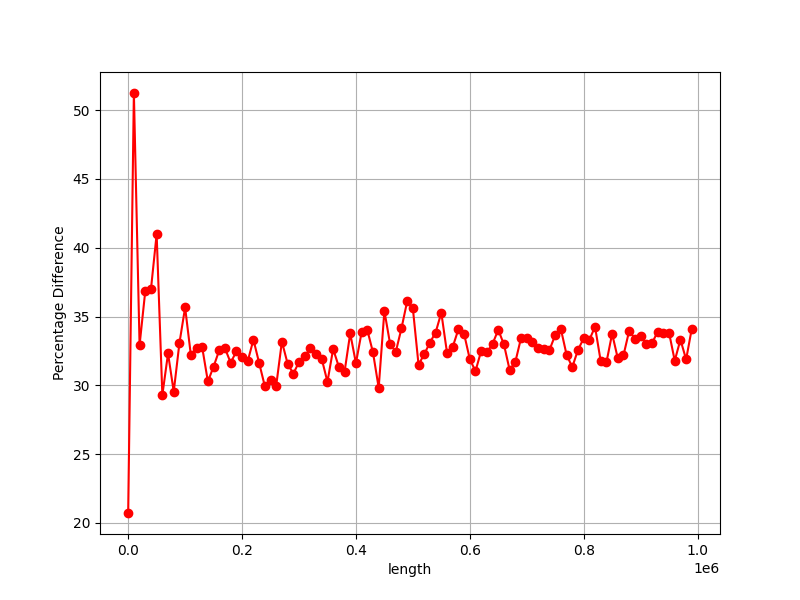
> Hello again. I want to show you the graphs of when we increase the length
> vector/array sorting time (ns). What do you think about graphs?
>
> Best regards, Stepan Neretin.
>
> Hello again :) I made a mistake in the benchmarks code. I am attaching new
> corrected benchmarks for int sorting as example. And my stupid, simple
> python script for making benchs and draw graphs. What do you think about
> this graphs?
>
>
> Best regards, Stepan Neretin.
>
