| From: | Jürgen Purtz <juergen(at)purtz(dot)de> |
|---|---|
| To: | pgsql-docs(at)postgresql(dot)org |
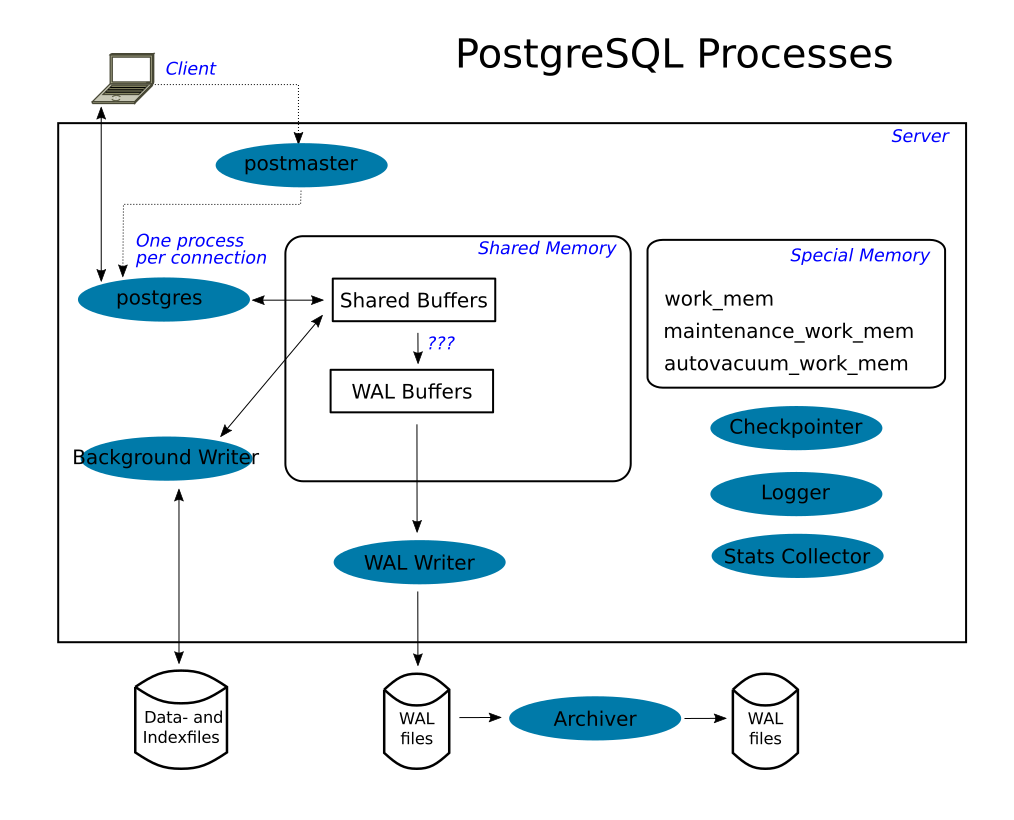
| Subject: | Re: Graphic to visualize data flow between processes, buffers and files |
| Date: | 2016-01-05 19:05:37 |
| Message-ID: | 568C1401.1080209@purtz.de |
| Views: | Whole Thread | Raw Message | Download mbox | Resend email |
| Thread: | |
| Lists: | pgsql-docs pgsql-novice |
On 04.01.2016 16:46, Tom Lane wrote:
> There have been discussions about how to incorporate graphics, which
> have failed to come to any consensus. Nobody is particularly willing
> to put a badly-formatted batch of raw numbers into git though, because
> it'd be impossible to do any incremental updates on it and still have
> useful git history. There are also a bunch of questions about whether
> the graphics would work in all the output formats we try to support.
>
> This particular example doesn't really seem compelling enough to
> justify finding a way over those hurdles ...
In 2010/11 we had a discussion about SVG editors and SVG cleaner tools:
http://www.postgresql.org/message-id/flat/201006302218(dot)o5UMI7Y20379(at)momjian(dot)us#201006302218(dot)o5UMI7Y20379@momjian.us.
5 years later we should take a second chance to bring graphics to the
documentation.
After some research I propose a collection of rules and hope that they
will fulfill our needs. Please proof and extend the below-mentioned
steps to a useful cookbook.
Principles:
* Use the tool (text editor, xml-editor, svg-editor) and SVG-cleaner
of your choice.
* Produce pure standard compliant
(xmlns:svg="http://www.w3.org/2000/svg") SVG text files without any
additional XML-namespace.
Recommendations:
* We suggest the use of Inkscape. It creates the above mentioned
format by performing the following steps
o File | Clean up document
o File | Save as | Plain SVG
* If you insist to use complex objects like connectors we suggest the
use of Inkscape's SVG format for your working file and the two steps
mentioned above to create the destination file. In the destination
file complex objects are fragmented into simple objects but they are
rendered in the same way as before.
* You can copy complex objects like UML shapes from any SVG tool to
Inkscape by performing the following steps
o Create the object with the tool of your choice in an temporary file
o Export the graphic to SVG or Plain SVG format
o Open this SVG file in Inkscape
o Copy / Past the object to your working file
o If necessary group the fragments of the new object to one object
* Although other SVG editors support 'Plain SVG' format via their
export-command as well as Inkscape, the results of Inkscape's
approach seams to be nearly optimal.
* Nevertheless Inkscape's output in 'Plain SVG' format is not optimal.
There are some superfluous objects which can be ignored or removed
with a text editor:
o Within <metadata> the descriptions use the namespaces rdf, cc
and dc instead of svg's elements.
o Within the style attribute sometimes there are
'-inkscape-font-specification' instructions. They are redundant
as they have the same contents as the also present and standard
conform font-style instructions (Inkscape bug?).
o Some objects imported from other SVN tools fills the attribute
'class' with values like "com.sun.star.drawing.xxx". Test such
objects and/or remove the values.
* Don't use "Objects | Symbols" as it creates an additional namespace
'xlink'.
* If you create a PNG file (File | Export PNG Image), you should
previously set the background color of the image (File | Document
Properties) to RGB ffffffff or any color of your choice. Otherwise
some PNG viewer shows an odd background.
Advantages:
* Files in plain SVG format are text files and therefore diff-able. As
they are also XML-files, it is a good idea to use an xml-diff tool
(better granularity, ignoring of newlines and other white spaces,
ignoring the different syntax for empty tags, ignoring xml-attribute
sequence, ...).
* As fare as I have seen the plain SVG as well as the PNG leads to
identical rendering in different viewers.
* Inkscape is able to produce PDF files out of its plain SVG files -
as well as a lot of other tools.
* Inkscape offers a window where you can control (and partly modify)
the xml representation of an object.
Disadvantages:
* There is no guaranty that the resulting plain SVG file will be
rendered by every other SVG tool in the same way as it is done in
Inkscape. In my opinion this is a failure of SVG tools - they have a
different understanding of some SVG elements. Hopefully SVG 2 will
bring some progress (in the far future).
* The proceeding is very time consumptive in comparison to the use of
the sophisticated features of a single product.
Regards, Jürgen Purtz
| Attachment | Content-Type | Size |
|---|---|---|
| pg_processes_inkscape.plain.svg | image/svg+xml | 66.0 KB |
| pg_processes_inkscape.plain.png | image/png | 109.2 KB |
| From | Date | Subject | |
|---|---|---|---|
| Next Message | Alvaro Herrera | 2016-01-05 19:33:34 | Re: Graphic to visualize data flow between processes, buffers and files |
| Previous Message | Tom Lane | 2016-01-04 15:46:00 | Re: Graphic to visualize data flow between processes, buffers and files |
| From | Date | Subject | |
|---|---|---|---|
| Next Message | Alvaro Herrera | 2016-01-05 19:33:34 | Re: Graphic to visualize data flow between processes, buffers and files |
| Previous Message | Killian Driscoll | 2016-01-04 22:25:01 | How can I combine these two dependent views into one view? |