| From: | Vladimir Ryabtsev <greatvovan(at)gmail(dot)com> |
|---|---|
| To: | zejn(at)owca(dot)info |
| Cc: | pgsql-performance(at)lists(dot)postgresql(dot)org |
| Subject: | Re: Why could different data in a table be processed with different performance? |
| Date: | 2018-09-25 20:28:22 |
| Message-ID: | CAMqTPqmsxoDVW_hvytRbuAJAZoW88ks=o9fd1qK70=2SjR9CLQ@mail.gmail.com |
| Views: | Whole Thread | Raw Message | Download mbox | Resend email |
| Thread: | |
| Lists: | pgsql-performance |
> 1) Which file system are you using?
From Linux's view it's ext4. Real vmdx file on Hyper-V is stored on NTFS,
as far as I know.
> 2) What is the segment layout of the LVM PVs and LVs?
I am a bit lost with it. Is that what you are asking about?
master:
# pvs --segments
PV VG Fmt Attr PSize PFree Start SSize
/dev/sda5 ubuntu-vg lvm2 a-- 19.76g 20.00m 0 4926
/dev/sda5 ubuntu-vg lvm2 a-- 19.76g 20.00m 4926 127
/dev/sda5 ubuntu-vg lvm2 a-- 19.76g 20.00m 5053 5
# lvs --segments
LV VG Attr #Str Type SSize
root ubuntu-vg -wi-ao--- 1 linear 19.24g
swap_1 ubuntu-vg -wi-ao--- 1 linear 508.00m
slave:
# pvs --segments
PV VG Fmt Attr PSize PFree Start SSize
/dev/sda3 postgresnlpslave-vg lvm2 a-- 429.77g 0 0 110021
/dev/sda5 postgresnlpslave-vg lvm2 a-- 169.52g 0 0 28392
/dev/sda5 postgresnlpslave-vg lvm2 a-- 169.52g 0 28392 2199
/dev/sda5 postgresnlpslave-vg lvm2 a-- 169.52g 0 30591 2560
/dev/sda5 postgresnlpslave-vg lvm2 a-- 169.52g 0 33151 10246
/dev/sdb1 postgresnlpslave-vg lvm2 a-- 512.00g 0 0 131071
# lvs --segments
LV VG Attr #Str Type SSize
root postgresnlpslave-vg -wi-ao---- 1 linear 110.91g
root postgresnlpslave-vg -wi-ao---- 1 linear 40.02g
root postgresnlpslave-vg -wi-ao---- 1 linear 10.00g
root postgresnlpslave-vg -wi-ao---- 1 linear 429.77g
root postgresnlpslave-vg -wi-ao---- 1 linear 512.00g
swap_1 postgresnlpslave-vg -wi-ao---- 1 linear 8.59g
> 3) Do you use LVM for any "extra" features, such as snapshots?
I don't think so, but how to check? vgs gives #SN = 0, is that it?
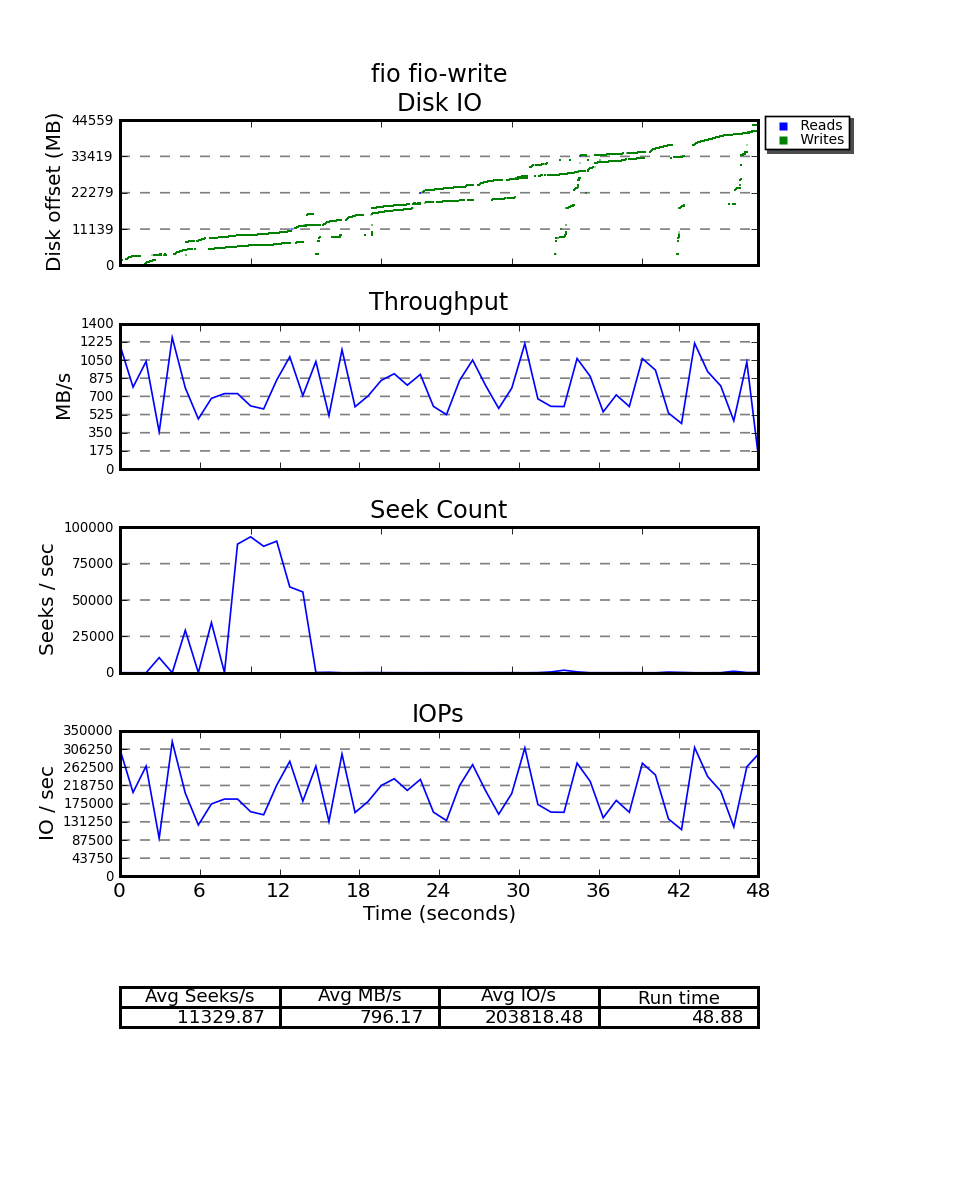
> 4) You can try using seekwatcher to see where on the disk the slowness is
occurring. You get a chart similar to this
http://kernel.dk/dd-md0-xfs-pdflush.png
> 5) BCC is a collection of tools that might shed a light on what is
happening. https://github.com/iovisor/bcc
Will look into it.
Regards,
Vlad
| From | Date | Subject | |
|---|---|---|---|
| Next Message | David Rowley | 2018-09-25 20:55:24 | Re: To keep indexes in memory, is large enough effective_cache_size enough? |
| Previous Message | Alvaro Herrera | 2018-09-25 19:38:51 | Re: link to Slow_Query_Questions from wiki/Main Page |