Re: Pgadmin4 System Stats Extension Design
| From: | Sahil Harpal <sahilharpal1234(at)gmail(dot)com> |
|---|---|
| To: | Dave Page <dpage(at)pgadmin(dot)org> |
| Cc: | Aditya Toshniwal <aditya(dot)toshniwal(at)enterprisedb(dot)com>, Akshay Joshi <akshay(dot)joshi(at)enterprisedb(dot)com>, pgadmin-hackers(at)postgresql(dot)org, Khushboo Vashi <khushboo(dot)vashi(at)enterprisedb(dot)com> |
| Subject: | Re: Pgadmin4 System Stats Extension Design |
| Date: | 2023-06-24 21:01:59 |
| Message-ID: | CAKi=nndoS4g8MmOBD6wZKCtGotpmxDa17rq8-obv3B9MaSbYjg@mail.gmail.com |
| Views: | Whole Thread | Raw Message | Download mbox | Resend email |
| Thread: | |
| Lists: | pgadmin-hackers |
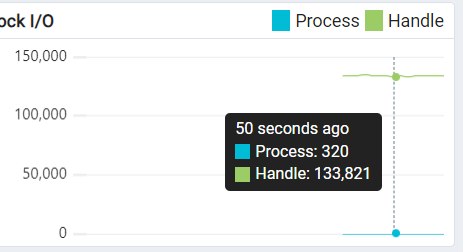
I tried combining the process and handle count in a single graph. But as
you can see in the attached image, insights are not properly visible since
the difference between the values is too large. Even when the process count
is 320, without tooltips, it appears as zero. Can we draw separate graphs
for both? Or do you think the current single combined version is fine?
| Attachment | Content-Type | Size |
|---|---|---|
|
image/png | 16.3 KB |
In response to
- Re: Pgadmin4 System Stats Extension Design at 2023-06-20 09:39:55 from Dave Page
Responses
- Re: Pgadmin4 System Stats Extension Design at 2023-06-24 21:32:03 from Dave Page
Browse pgadmin-hackers by date
| From | Date | Subject | |
|---|---|---|---|
| Next Message | Dave Page | 2023-06-24 21:32:03 | Re: Pgadmin4 System Stats Extension Design |
| Previous Message | Akshay Joshi | 2023-06-23 13:47:06 | [pgadmin-org/pgadmin4] ca0111: Typecast some parameters before sending to GUI in ... |