| From: | "sunyucong(at)gmail(dot)com" <sunyucong(at)gmail(dot)com> |
|---|---|
| To: | pgsql-general(at)lists(dot)postgresql(dot)org |
| Subject: | Need help debugging slow logical replication |
| Date: | 2023-02-07 23:38:13 |
| Message-ID: | CAJygYd0Wi=Mki7sVc2p3GOJRCjCfOyDk3WRez1zYUiC2ODjSWg@mail.gmail.com |
| Views: | Whole Thread | Raw Message | Download mbox | Resend email |
| Thread: | |
| Lists: | pgsql-general |
Hi there,
I am using PG 14.14 on both primary and secondary DB on AWS, setup
using a logical replication, I'm having trouble with huge replication
lag.
My setup is as follows:
P1 - physical - P1-R
| (logical)
P2 - physical - P2-R
The lag between P1 & P1-R , P2 & P2-R are both minimal , less than
10seconds , but I'm seeing several hours of lag between P1 & P2 .We
currently have 1 pub/sub that covers about 100 tables.
Here is the output from P1 showing there is a Lag of at least 80GB
(keep growing)
> SELECT now() AS CURRENT_TIME,
slot_name,
active,
active_pid,confirmed_flush_lsn,
pg_size_pretty(pg_wal_lsn_diff(pg_current_wal_lsn(),
confirmed_flush_lsn)) AS diff_size,
pg_wal_lsn_diff(pg_current_wal_lsn(), confirmed_flush_lsn) AS diff_bytes
FROM pg_replication_slots
WHERE slot_type = 'logical';
-[ RECORD 1 ]-------+---------------------------
current_time | 2023-02-07 23:26:00.733+00
slot_name | upgrade
active | t
active_pid | 5180
confirmed_flush_lsn | 26B09/8C08C610
diff_size | 81 GB
diff_bytes | 86573472240
Here is what pg_stat_replication shows: note that the write_lag is
very high: we previously had to set wal_sender_timeout to 0, otherwise
the logical replication work keep exiting and fail.
> select * from pg_stat_replication;
-[ RECORD 1 ]----+------------------------------
pid | xxx
usesysid | xxx
usename | dev
application_name | upgrade_target
client_addr | 10.xxx
client_hostname |
client_port | 27404
backend_start | 2023-02-07 23:02:39.228572+00
backend_xmin | 2909692747
state | catchup
sent_lsn | 26B09/8C08C610
write_lsn | 26B09/840514C0
flush_lsn | 26B09/840514C0
replay_lsn | 26B09/840514C0
write_lag | 00:07:03.60362
flush_lag | 00:07:03.60362
replay_lag | 00:07:03.60362
sync_priority | 0
sync_state | async
reply_time | 2023-02-07 23:22:08.245066+00
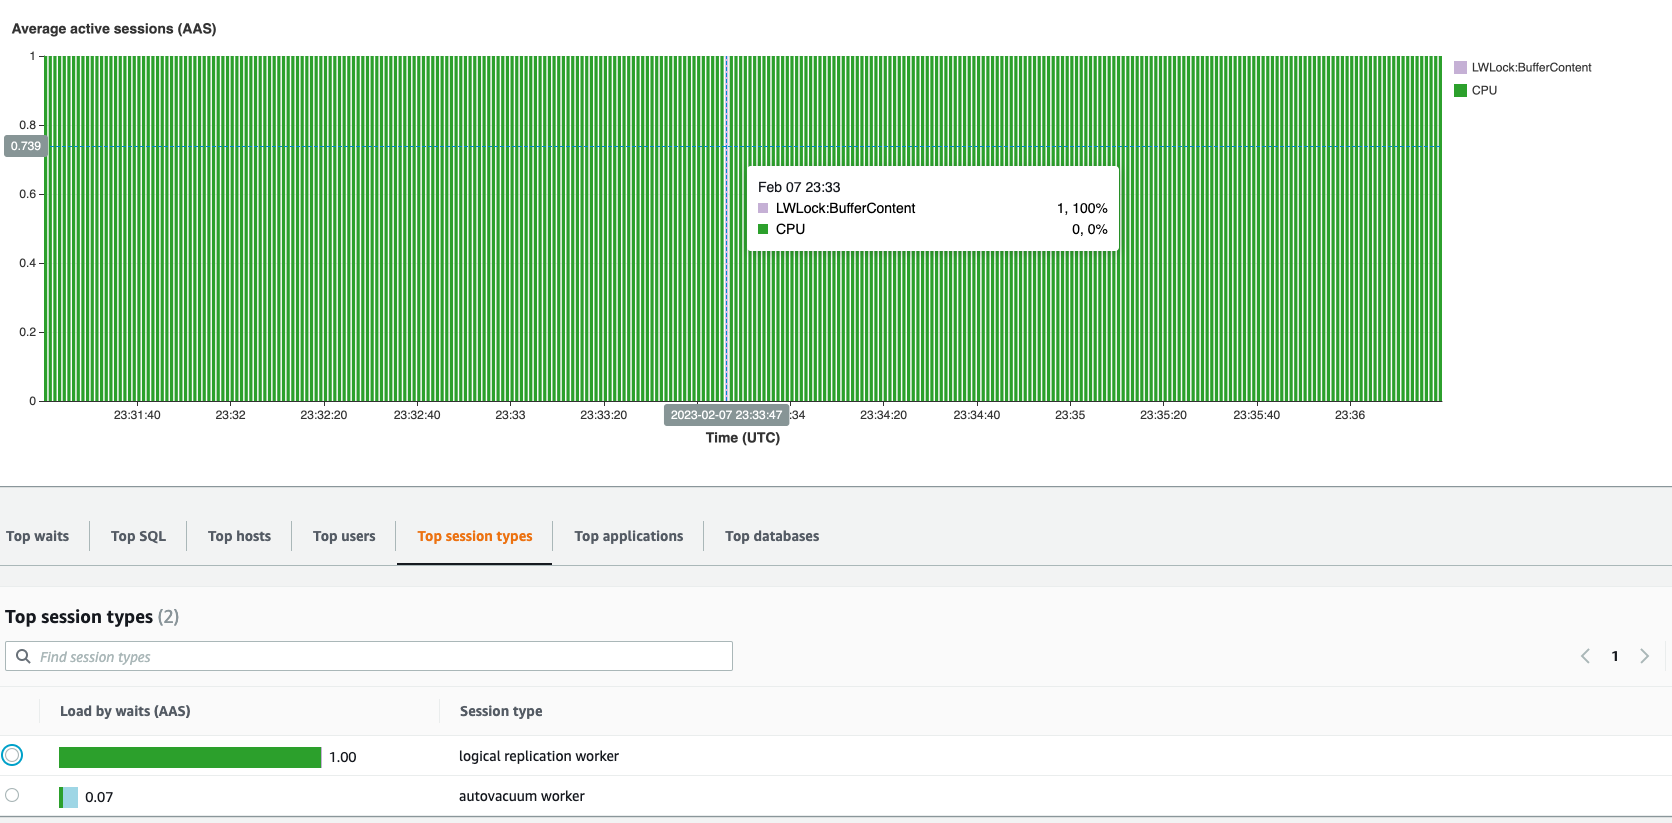
So, the problem seems to be like P2 takes a very long time to apply a
chunk, Mow, my question is why? From AWS performance insight, it
looks like there is only 1 process running on P2, that is 100% blocked
by CPU. I don't really understand why it is being blocked by the CPU,
and any help in further debugging is much appreciated.
Cheers.
| Attachment | Content-Type | Size |
|---|---|---|
| image.png | image/png | 117.8 KB |
| From | Date | Subject | |
|---|---|---|---|
| Next Message | Brad White | 2023-02-07 23:42:11 | Re: PostgreSQL |
| Previous Message | Thomas Munro | 2023-02-07 21:51:08 | Re: Too coarse predicate locks granularity for B+ tree indexes |