Same query taking less time in low configuration machine
| From: | Vishwa Kalyankar <vishwakalyankar8(at)gmail(dot)com> |
|---|---|
| To: | pgsql-performance(at)lists(dot)postgresql(dot)org |
| Subject: | Same query taking less time in low configuration machine |
| Date: | 2020-07-16 15:43:45 |
| Message-ID: | CAFWaVn3=DO-_Q3vO30XB49hq+Cx=cgVU1A+qJtkdswvbjt=_WA@mail.gmail.com |
| Views: | Whole Thread | Raw Message | Download mbox | Resend email |
| Thread: | |
| Lists: | pgsql-performance |
Hi,
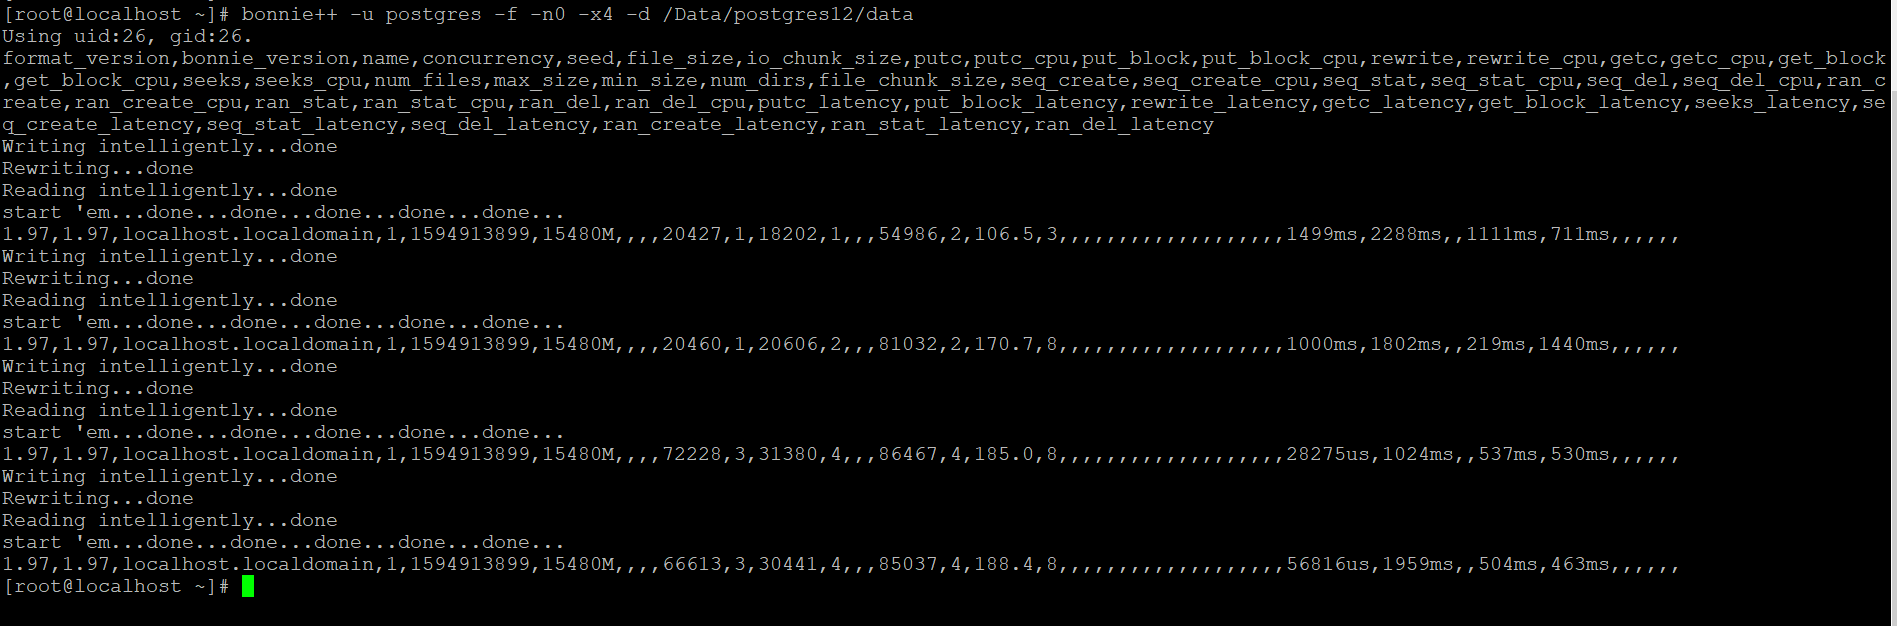
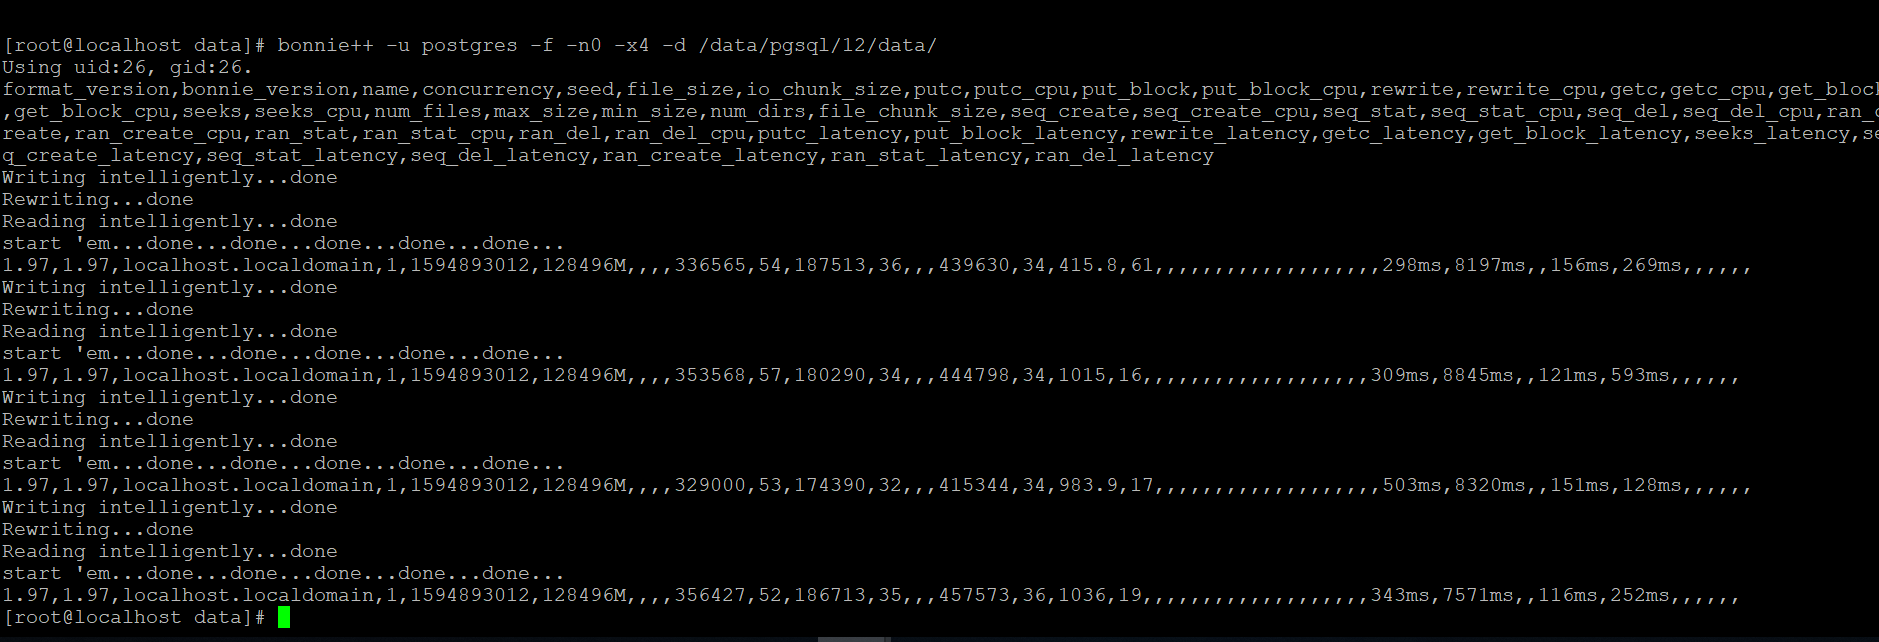
I have two machines - one with 8GB RAM & 4core CPU and the other with 64GB
Ram & 24 core CPU. Both machines have the same DB (Postgres 12 + Postgis
2.5.3). Same query is taking less time in low end machine whereas more
time in high end machine. Any thoughts on where to look? I have tuned the
db in both machines according to https://pgtune.leopard.in.ua/#/, the
function will refer around 14 tables, since both the tables are have same
index and views. <https://pgtune.leopard.in.ua/#/>
Please find the attachment for query explain & analyze and bonnie result
of both the machines.
Low End Machine
-bash-4.2$ psql -p 5434
psql (12.3)
Type "help" for help.
postgres=# \c IPDS_KSEB;
You are now connected to database "IPDS_KSEB" as user "postgres".
IPDS_KSEB=# explain analyze select * from
kseb_geometry_trace_with_barrier_partition(5,'kottarakara_version',437,'htline',2)
;
QUERY PLAN
---------------------------------------------------------------------------------------------------------------------------------------------------------
Function Scan on kseb_geometry_trace_with_barrier_partition
(cost=0.25..10.25 rows=1000 width=169) (actual time=11626.548..11626.568
rows=254 loops=1)
Planning Time: 0.212 ms
Execution Time: *11628.590 ms*
High End Machine
-bash-4.2$ psql -p 5422
psql (12.3)
Type "help" for help.
postgres=# \c IPDS_KSEB;
You are now connected to database "IPDS_KSEB" as user "postgres".
IPDS_KSEB=# explain analyze select * from
kseb_geometry_trace_with_barrier_partition(5,'kottarakara_version',437,'htline',2)
;
QUERY PLAN
---------------------------------------------------------------------------------------------------------------------------------------------------------
Function Scan on kseb_geometry_trace_with_barrier_partition
(cost=0.25..10.25 rows=1000 width=169) (actual time=22304.425..22304.448
rows=254 loops=1)
Planning Time: 0.219 ms
Execution Time: *22352.219 ms*
(3 rows)
| Attachment | Content-Type | Size |
|---|---|---|
|
image/png | 59.4 KB |
|
image/png | 68.4 KB |
Responses
- Re: Same query taking less time in low configuration machine at 2020-07-16 16:04:23 from Justin Pryzby
Browse pgsql-performance by date
| From | Date | Subject | |
|---|---|---|---|
| Next Message | Justin Pryzby | 2020-07-16 16:04:23 | Re: Same query taking less time in low configuration machine |
| Previous Message | Justin Pryzby | 2020-07-15 20:03:26 | Re: Sudden insert performance degradation |