| From: | akp geek <akpgeek(at)gmail(dot)com> |
|---|---|
| To: | Tomas Vondra <tv(at)fuzzy(dot)cz> |
| Cc: | pgsql-general <pgsql-general(at)postgresql(dot)org> |
| Subject: | Re: Need some help on Performance 9.0.4 |
| Date: | 2013-10-18 15:06:07 |
| Message-ID: | CACnhOf+Wocd5s1X+fkRPL1pyXRPyFrJ-XW0EdccZ82LimGJksQ@mail.gmail.com |
| Views: | Whole Thread | Raw Message | Download mbox | Resend email |
| Thread: | |
| Lists: | pgsql-general |
when I issue the top command on solaris, what ever I have posted is exactly
getting.
top -n
load averages: 11.4, 10.8, 10.2; up 680+21:31:46
15:05:21
137 processes: 123 sleeping, 14 on cpu
CPU states: 82.0% idle, 17.5% user, 0.5% kernel, 0.0% iowait, 0.0% swap
Memory: 64G phys mem, 20G free mem, 63G total swap, 63G free swap
PID USERNAME LWP PRI NICE SIZE RES STATE TIME CPU COMMAND
12185 postgres 1 50 0 3172M 3165M cpu/0 9:56 1.80% postgres
23338 postgres 1 50 0 3180M 3173M cpu/8 79:08 1.77% postgres
2446 postgres 1 0 0 3174M 3167M cpu/24 0:58 1.76% postgres
18359 postgres 1 0 0 3172M 3164M cpu/46 4:00 1.60% postgres
28428 postgres 1 0 0 3178M 3171M cpu/17 58:15 1.60% postgres
10698 postgres 1 0 0 3179M 3173M cpu/62 68:33 1.55% postgres
28374 postgres 1 0 0 3178M 3172M cpu/14 47:01 1.55% postgres
6145 postgres 1 0 0 3180M 3173M cpu/39 115:05 1.55% postgres
2380 postgres 1 0 0 3179M 3172M cpu/34 53:38 1.54% postgres
2088 postgres 1 0 0 3179M 3172M cpu/31 37:43 1.51% postgres
19360 postgres 1 50 0 3172M 3165M cpu/3 6:55 0.84% postgres
28426 postgres 1 19 0 3179M 3172M cpu/21 70:34 0.61% postgres
21196 postgres 1 52 0 3403M 3392M sleep 0:05 0.37% postgres
21237 root 1 49 0 5632K 4000K cpu/51 0:00 0.11% sshd
415 daemon 6 59 0 6312K 3208K sleep 107:52 0.02% kcfd
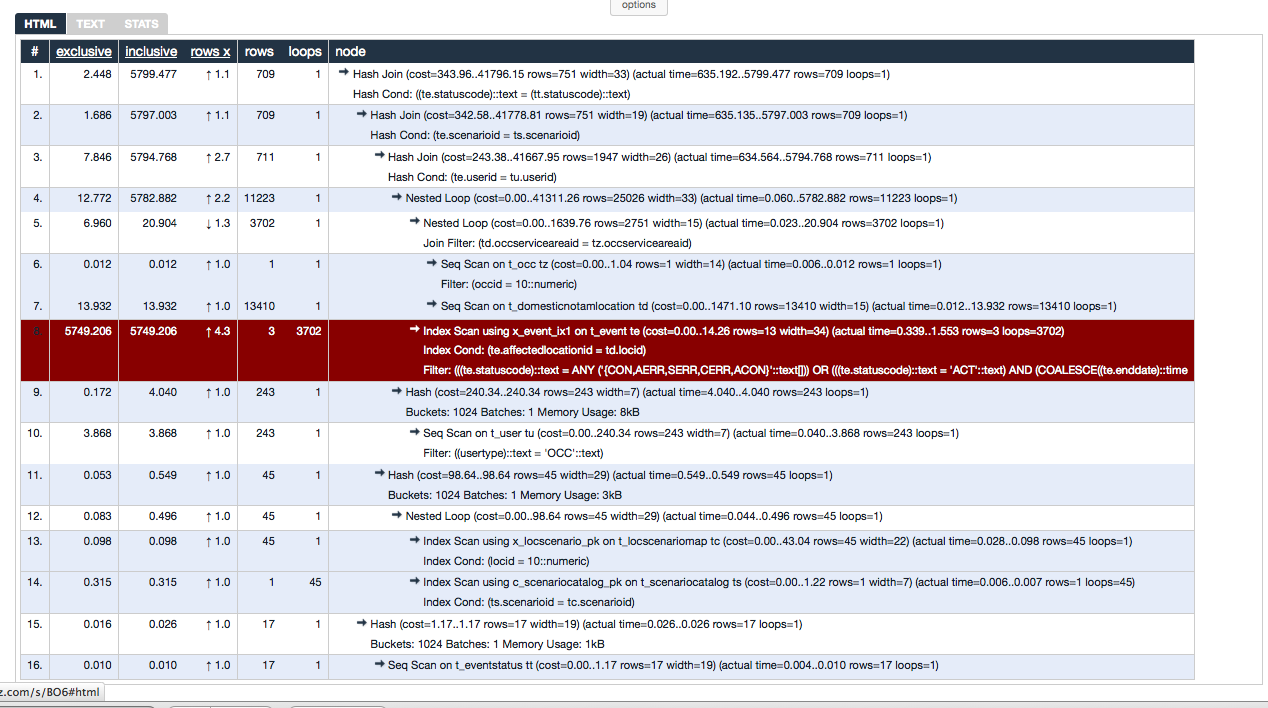
this is the plan that was generated again.. Thanks a lot.
Hash Join (cost=343.96..41796.15 rows=751 width=33) (actual
time=635.192..5799.477 rows=709 loops=1)
Hash Cond: ((te.statuscode)::text = (tt.statuscode)::text)
-> Hash Join (cost=342.58..41778.81 rows=751 width=19) (actual
time=635.135..5797.003 rows=709 loops=1)
Hash Cond: (te.scenarioid = ts.scenarioid)
-> Hash Join (cost=243.38..41667.95 rows=1947 width=26)
(actual time=634.564..5794.768 rows=711 loops=1)
Hash Cond: (te.userid = tu.userid)
-> Nested Loop (cost=0.00..41311.26 rows=25026
width=33) (actual time=0.060..5782.882 rows=11223 loops=1)
-> Nested Loop (cost=0.00..1639.76 rows=2751
width=15) (actual time=0.023..20.904 rows=3702 loops=1)
Join Filter: (td.occserviceareaid =
tz.occserviceareaid)
-> Seq Scan on t_occ tz (cost=0.00..1.04
rows=1 width=14) (actual time=0.006..0.012 rows=1 loops=1)
Filter: (occid = 10::numeric)
-> Seq Scan on t_domesticnotamlocation td
(cost=0.00..1471.10 rows=13410 width=15) (actual time=0.012..13.932
rows=13410 loops=1)
-> Index Scan using x_event_ix1 on t_event te
(cost=0.00..14.26 rows=13 width=34) (actual time=0.339..1.553 rows=3
loops=3702)
Index Cond: (te.affectedlocationid = td.locid)
Filter: (((te.statuscode)::text = ANY
('{CON,AERR,SERR,CERR,ACON}'::text[])) OR (((te.statuscode)::text =
'ACT'::text) AND (COALESCE((te.enddate)::time
stamp with time zone, now()) >= (now() - '2 days'::interval))) OR
(((te.statuscode)::text = 'CAN'::text) AND (te.canceldate >= (now() -
'2 days'::interval))) OR (((te.statuscode)
::text = ANY ('{APEN,CINP,AINP}'::text[])) AND
(COALESCE((te.enddate)::timestamp with time zone, now()) >= now())))
-> Hash (cost=240.34..240.34 rows=243 width=7)
(actual time=4.040..4.040 rows=243 loops=1)
Buckets: 1024 Batches: 1 Memory Usage: 8kB
-> Seq Scan on t_user tu (cost=0.00..240.34
rows=243 width=7) (actual time=0.040..3.868 rows=243 loops=1)
Filter: ((usertype)::text = 'OCC'::text)
-> Hash (cost=98.64..98.64 rows=45 width=29) (actual
time=0.549..0.549 rows=45 loops=1)
Buckets: 1024 Batches: 1 Memory Usage: 3kB
-> Nested Loop (cost=0.00..98.64 rows=45 width=29)
(actual time=0.044..0.496 rows=45 loops=1)
-> Index Scan using x_locscenario_pk on
t_locscenariomap tc (cost=0.00..43.04 rows=45 width=22) (actual
time=0.028..0.098 rows=45 loops=1)
Index Cond: (locid = 10::numeric)
-> Index Scan using c_scenariocatalog_pk on
t_scenariocatalog ts (cost=0.00..1.22 rows=1 width=7) (actual
time=0.006..0.007 rows=1 loops=45)
Index Cond: (ts.scenarioid = tc.scenarioid)
-> Hash (cost=1.17..1.17 rows=17 width=19) (actual
time=0.026..0.026 rows=17 loops=1)
Buckets: 1024 Batches: 1 Memory Usage: 1kB
-> Seq Scan on t_eventstatus tt (cost=0.00..1.17 rows=17
width=19) (actual time=0.004..0.010 rows=17 loops=1)
On Thu, Oct 17, 2013 at 4:40 PM, Tomas Vondra <tv(at)fuzzy(dot)cz> wrote:
> On 17.10.2013 20:56, akp geek wrote:
> > got the output from depesz and this the top on the system. thanks for
> > the help ..
>
> From depesz? That site works differently - you enter the explain plan
> into the form, it does some formatting/highlighting and you're supposed
> to submit the link to that page. E.g. http://explain.depesz.com/s/JwTB
> is for your query.
>
> However it seems you've done some anonymization on the query, e.g.
> replacing the table/index/function names and string literals with some
> random words.
>
> Anyway, the plan shows the estimates are reasonably accurate, but the
> index scan on romeo_four consumes ~99% of the query duration. Not sure
> if it can be improved, because we don't know the original query and the
> anonymization made it rather annoying to deal with.
>
> >
> > Regards
> >
> > load averages: 30.3, 28.8, 27.8; up
> > 680+00:51:09
> > 18:24:44
> > 156 processes: 123 sleeping, 33 on cpu
> > CPU states: 49.5% idle, 50.0% user, 0.4% kernel, 0.0% iowait, 0.0%
> swap
> > Memory: 64G phys mem, 19G free mem, 63G total swap, 63G free swap
> >
> > PID USERNAME LWP PRI NICE SIZE RES STATE TIME CPU COMMAND
> > 7965 postgres 1 20 0 3178M 3171M cpu/7 78:21 1.58% postgres
> > 20638 postgres 1 20 0 3181M 3175M cpu/28 187:01 1.58% postgres
> > 22819 postgres 1 30 0 3181M 3175M cpu/33 264:06 1.57% postgres
> > 3789 postgres 1 20 0 3183M 3176M cpu/9 626:11 1.57% postgres
> > 10375 postgres 1 30 0 3182M 3175M cpu/50 293:55 1.57% postgres
> > 27335 postgres 1 30 0 3175M 3169M cpu/29 27:27 1.57% postgres
> > 7959 postgres 1 30 0 3178M 3171M cpu/41 104:07 1.57% postgres
> > 8156 postgres 1 30 0 3180M 3173M cpu/43 124:18 1.56% postgres
> > 20640 postgres 1 0 0 3182M 3176M cpu/58 207:49 1.56% postgres
> > 10584 postgres 1 30 0 3179M 3173M cpu/35 76:32 1.56% postgres
> > 13984 postgres 1 30 0 3181M 3174M cpu/30 207:04 1.56% postgres
> > 3575 postgres 1 20 0 3283M 3261M cpu/19 1:48 1.56% postgres
> > 7964 postgres 1 40 0 3177M 3170M cpu/62 82:56 1.56% postgres
> > 1299 postgres 1 40 0 3166M 3161M cpu/52 5:11 1.56% postgres
> > 27692 postgres 1 0 0 3181M 3174M cpu/46 260:58 1.56% postgres
>
>
> Once again, this top output is incomplete - all it lists are postgres
> processes (and it's unclear what they're doing), but there are certainly
> some other processes running. Moreover, those 15 processes account for
> only ~25% of CPU, but there's almost 50% CPU utilized. So where's the rest?
>
> Tomas
>
| Attachment | Content-Type | Size |
|---|---|---|
| Screen Shot 2013-10-18 at 11.00.13 AM.png | image/png | 218.8 KB |
| From | Date | Subject | |
|---|---|---|---|
| Next Message | Helen Griffiths | 2013-10-18 15:07:03 | Cannot import logs from csv |
| Previous Message | Tom Lane | 2013-10-18 15:05:07 | Re: How do I create a box from fields in a table? |