Bi-modal streaming replication throughput
| From: | Alexis Lê-Quôc <alq(at)datadoghq(dot)com> |
|---|---|
| To: | pgsql-performance(at)postgresql(dot)org |
| Subject: | Bi-modal streaming replication throughput |
| Date: | 2018-08-14 13:18:55 |
| Message-ID: | CAAGz8TNwea9QTzpqWt5v83hWC8x+CwcfP=b3-aFgKLUbQTwPOQ@mail.gmail.com |
| Views: | Whole Thread | Raw Message | Download mbox | Resend email |
| Thread: | |
| Lists: | pgsql-performance |
Hi,
I have been puzzled by very different replication performance (meaning
50-100x slower) between identical replicas (both in “hardware” and
configuration) once the amount of data to replicate increases. I’ve gone
down a number of dead ends and am missing something
(
likely obvious
)
that I hope folks with a deeper knowledge can point out. I’ve tried to boil
down the data need to describe the issue to a minimum.
Thanks for taking the time to read and for any ideas you can share.
# The setup
We run
a cluster of
large, SSD-backed, i3.16xl (64 cores visible to Linux, ~500GB of RAM, with
8GB of shared_buffers, fast NVMe drives) nodes
, each
running PG 9.3
on linux
in a vanilla streaming asynchronous replication setup: 1 primary node, 1
replica designated for failover (left alone) and 6 read replicas, taking
queries.
Under normal circumstances this is working exactly as planned but when I
dial up the number of INSERTs on the primary to ~10k rows per second, or
roughly 50MB of data per second (not enough to saturate the network between
nodes)
, read replicas falls hopelessly and consistently behind until read traffic
is diverted away
. The INSERTs themselves are fairly straightforward: a 20-bytea checksum is
computed off-node
and used as a unicity constraint at insert time. Each record is 4,500 bytes
wide on average.
H
ere’s the table where inserts happen.
Table “T”
Column | Type | Modifiers
| Storage |
----------------+-----------------------------+----------------------------------------+----------+
key | bigint | not null default
T.next_key()
| plain |
a | integer | not null
| plain |
b | integer |
| plain |
c | text |
| extended |
d | text |
| extended |
e | text[] |
| extended |
f | integer | not null
| plain |
created | timestamp without time zone | not null default now()
| plain |
cksum | bytea | not null
| extended |
Indexes:
“T_pkey" PRIMARY KEY, btree (key)
“T_cksum” UNIQUE, btree (cksum)
“T_created_idx" btree (created)
“T_full_idx" btree (a, b, c, d, e)
“T_a_idx" btree (a)
# The symptoms
Once the primary starts to process INSERTs to the tune of 10k/s (roughly
5
0MB/s or 150GB/h), replication throughput becomes bi-modal
within minutes.
1. We see read replicas fall behind and we can measure their replication
throughput to be
consistently
1-2% of what the primary is sustaining, by measuring the replication delay
(in second) every second. We quickly get
that metric
to 0.98-0.99 (1 means that replication is completely stuck
as it falls behind by one second every second
). CPU, memory
, I/O
(per core iowait)
or network
(throughput)
as a whole resource are not
visibly
maxed out
.
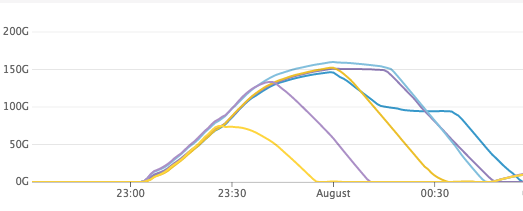
2. If we stop incoming queries from one of the replicas, we see it catch up
at 2x insert throughput (roughly 80MB/s or 300GB/h) as it is cutting
through the backlog. A perf sample shows a good chunk of time spent in
`mdnblocks`. I/O wait remains
at
a few %
(2-10) of cpu cycles. If you can open the attached screenshot you can see
the lag going down on each replica as soon as we stop sending reads at it.
In both cases the recovery process maxes out 1 core
as expected
.
# The question
What surprised me is the bi-modal nature of throughput without gradual
degradation
or a very clear indication of the contentious resource (I/O? Buffer access?)
.
The bi-modal throughput
would be consistent with replication being
effectively
scheduled to run
at full speed
1% or 2% of the time (the rest being allocated to queries) but I have not
found something in the documentation or in the code that
supports that view.
Is this the right way to think about what’s observed?
If not, what could be a good next hypothesis to test?
# References
Here are some settings that may help and a perf profile of a recovery
process that runs without any competing read traffic processing the INSERT
backlog (I don't unfortunately have the same profile on a lagging read
replica).
name | setting
------------------------------+-----------
max_wal_senders | 299
max_wal_size | 10240
min_wal_size | 5
wal_block_size | 8192
wal_buffers | 2048
wal_compression | off
wal_keep_segments | 0
wal_level | replica
wal_log_hints | off
wal_receiver_status_interval | 10
wal_receiver_timeout | 60000
wal_retrieve_retry_interval | 5000
wal_segment_size | 2048
wal_sender_timeout | 60000
wal_sync_method | fdatasync
wal_writer_delay | 200
wal_writer_flush_after | 128
shared_buffers | 1048576
work_mem | 32768
maintenance_work_mem | 2097152
recovery process sampled at 997Hz on a lagging replica without read traffic.
Samples: 9K of event 'cycles', Event count (approx.): 25040027878
Children Self Command Shared Object Symbol
+ 97.81% 0.44% postgres postgres [.] StartupXLOG
+ 82.41% 0.00% postgres postgres [.] StartupProcessMain
+ 82.41% 0.00% postgres postgres [.] AuxiliaryProcessMain
+ 82.41% 0.00% postgres postgres [.] 0xffffaa514b8004dd
+ 82.41% 0.00% postgres postgres [.] PostmasterMain
+ 82.41% 0.00% postgres postgres [.] main
+ 82.41% 0.00% postgres libc-2.23.so [.] __libc_start_main
+ 82.41% 0.00% postgres [unknown] [k] 0x3bb6258d4c544155
+ 50.41% 0.09% postgres postgres [.]
XLogReadBufferExtended
+ 40.14% 0.70% postgres postgres [.] XLogReadRecord
+ 39.92% 0.00% postgres postgres [.] 0xffffaa514b69524e
+ 30.25% 26.78% postgres postgres [.] mdnblocks
+ 27.35% 0.00% postgres postgres [.] heap_redo
+ 26.23% 0.01% postgres postgres [.] XLogReadBuffer
+ 25.37% 0.05% postgres postgres [.] btree_redo
+ 22.49% 0.07% postgres postgres [.]
ReadBufferWithoutRelcache
+ 18.72% 0.00% postgres postgres [.] 0xffffaa514b6a2e6a
+ 18.64% 18.64% postgres postgres [.] 0x00000000000fde6a
+ 18.10% 0.00% postgres postgres [.] 0xffffaa514b65a867
+ 15.80% 0.06% postgres [kernel.kallsyms] [k]
entry_SYSCALL_64_fastpath
+ 13.16% 0.02% postgres postgres [.] RestoreBackupBlock
+ 12.90% 0.00% postgres postgres [.] 0xffffaa514b675271
+ 12.53% 0.00% postgres postgres [.] 0xffffaa514b69270e
+ 10.29% 0.00% postgres postgres [.] 0xffffaa514b826672
+ 10.00% 0.03% postgres libc-2.23.so [.] write
+ 9.91% 0.00% postgres postgres [.] 0xffffaa514b823ffe
+ 9.71% 0.00% postgres postgres [.] mdwrite
+ 9.45% 0.24% postgres libc-2.23.so [.] read
+ 9.25% 0.03% postgres [kernel.kallsyms] [k] sys_write
+ 9.15% 0.00% postgres [kernel.kallsyms] [k] vfs_write
+ 8.98% 0.01% postgres [kernel.kallsyms] [k] new_sync_write
+ 8.98% 0.00% postgres [kernel.kallsyms] [k] __vfs_write
+ 8.96% 0.03% postgres [xfs] [k] xfs_file_write_iter
+ 8.91% 0.08% postgres [xfs] [k]
xfs_file_buffered_aio_write
+ 8.64% 0.00% postgres postgres [.] 0xffffaa514b65ab10
+ 7.87% 0.00% postgres postgres [.] 0xffffaa514b6752d0
+ 7.35% 0.04% postgres [kernel.kallsyms] [k] generic_perform_write
+ 5.77% 0.11% postgres libc-2.23.so [.] lseek64
+ 4.99% 0.00% postgres postgres [.] 0xffffaa514b6a3347
+ 4.80% 0.15% postgres [kernel.kallsyms] [k] sys_read
+ 4.74% 4.74% postgres [kernel.kallsyms] [k]
copy_user_enhanced_fast_string
| Attachment | Content-Type | Size |
|---|---|---|
|
image/png | 25.8 KB |
Responses
- Re: Bi-modal streaming replication throughput at 2018-08-14 14:51:25 from Jeff Janes
- Re: Bi-modal streaming replication throughput at 2018-08-14 17:46:45 from Andres Freund
Browse pgsql-performance by date
| From | Date | Subject | |
|---|---|---|---|
| Next Message | Pavel Stehule | 2018-08-14 14:38:56 | Re: [HACKERS] proposal: schema variables |
| Previous Message | Mariel Cherkassky | 2018-08-14 11:33:37 | Re: Fwd: increase insert into local table from remote oracle table preformance |