| From: | Neto pr <netopr9(at)gmail(dot)com> |
|---|---|
| To: | postgres performance list <pgsql-performance(at)postgresql(dot)org> |
| Subject: | Re: help in analysis of execution plans |
| Date: | 2018-05-05 18:07:26 |
| Message-ID: | CA+wPC0P+MvVUDzdVrx778zkpCc=Q_6Cz6XxpJ=dNJUoMkj8wrg@mail.gmail.com |
| Views: | Whole Thread | Raw Message | Download mbox | Resend email |
| Thread: | |
| Lists: | pgsql-performance |
Further information is that th Postgresql with modified source code, is
that I modified some internal functions of cost (source code) and
parameters in Postgresql.conf so that it is possible for the DBMS to
differentiate cost of read (random and sequence) and write (random and
sequence), this is because reading in SSDs' and more than 400 times faster
than HDD. This is due to academic research that I am doing.
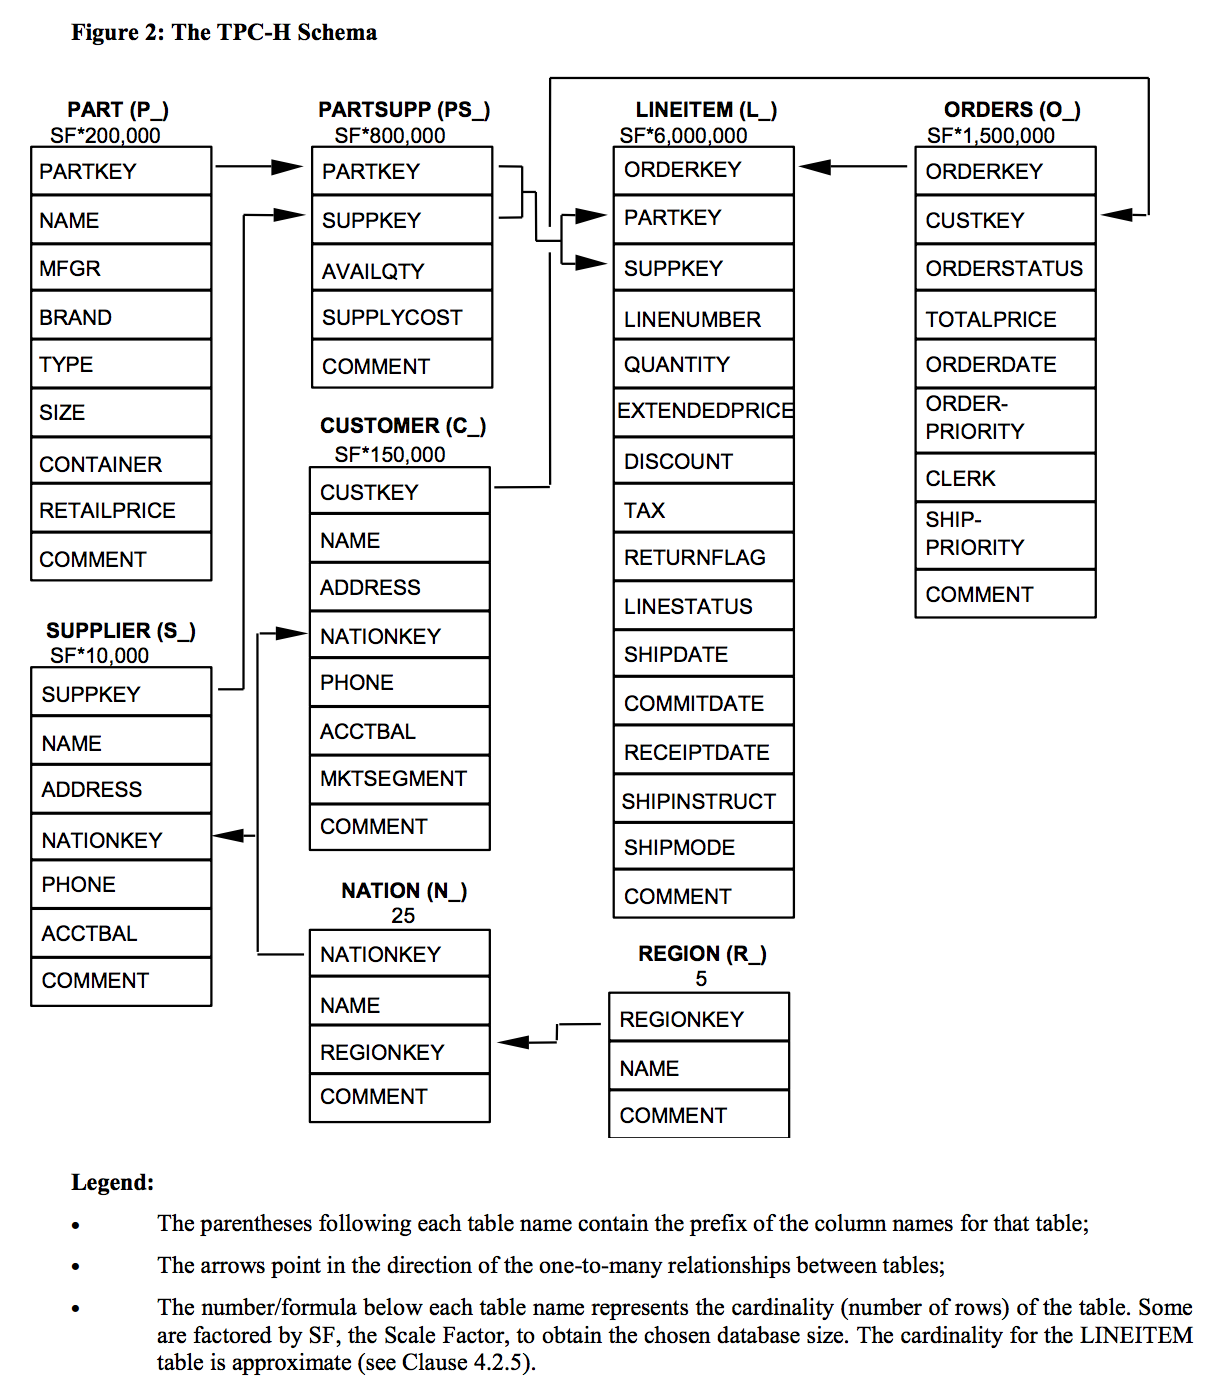
See schema of the tables used below:
https://docs.snowflake.net/manuals/_images/sample-data-tpch-schema.png
I am using 40g scale, in this way the lineitem table has (40 * 6 million)
240 million of the rows.
Regards
Neto
2018-05-05 8:16 GMT-07:00 Neto pr <netopr9(at)gmail(dot)com>:
> Dear all
>
> Could you help me understand these two execution plans for the same
> query (query 3 benchmark TPCH www.tpc.org/tpch) executed in two
> different environments of Postgresql, as described below. These plans
> were generated by the EXPLAIN ANALYZE command, and the time of plan 1
> was 4.7 minutes and plan 2 was 2.95 minutes.
>
> Execution Plan 1 (query execution time 4.7 minutes):
> - https://explain.depesz.com/s/Ughh
> - Postgresql version 10.1 (default) with index on l_shipdate (table
> lineitem)
>
> Execution Plan 2 (query execution time 2.95 minutes):
> - https://explain.depesz.com/s/7Zb7
> - Postgresql version 9.5 (version with source code changed by me) with
> index on l_orderkey (table lineitem).
>
> Some doubts
> - Difference between GroupAggregate and Finalize GroupAggregate
> - because some algorithms show measurements on "Disk" and others on
> "Memory" example:
> - External sort Disk: 52784kB
> - quicksort Memory: 47770kB
>
> Because one execution plan was much smaller than the other,
> considering that the query is the same and the data are the same.
> --------------------------------------------------
> select
> l_orderkey,
> sum(l_extendedprice * (1 - l_discount)) as revenue,
> o_orderdate,
> o_shippriority
> from
> customer,
> orders,
> lineitem
> where
> c_mktsegment = 'HOUSEHOLD'
> and c_custkey = o_custkey
> and l_orderkey = o_orderkey
> and o_orderdate < date '1995-03-21'
> and l_shipdate > date '1995-03-21'
> group by
> l_orderkey,
> o_orderdate,
> o_shippriority
> order by
> revenue desc,
> o_orderdate
> --------------------------------------------------
>
> best regards
>
| From | Date | Subject | |
|---|---|---|---|
| Next Message | David Rowley | 2018-05-06 00:33:36 | Re: help in analysis of execution plans |
| Previous Message | Neto pr | 2018-05-05 15:16:42 | help in analysis of execution plans |